In this case study I want to share with you the PKM system I built to accelerate my expertise in complex geopolitics🌎
Context
Understanding geopolitics is crucial to making sense of the modern world. I've always been fascinated by geopolitical complexities.
But at some point I realized: my knowledge is pretty shallow and has a lot of gaps.
So I decided to embark on a journey to deepen my understanding & close those gaps. That was a great decision! The things I discovered changed my view on how the world works.
But it took me some time to figure out the right approach.
At first, geopolitics looked intimidating and overwhelming. It requires a good grasp of multiple disciplines:
- History
- Geography
- Macroeconomics
- Political science
- International relations
- Cultural studies
- Game theory
- Complexity
- Psychology
Too much information. Too much complexity.
To deal with it, I've decided to build an environment in Tana that can facilitate my research.
An environment optimized for nonlinear exploration and active sensemaking.
General approach
I took a three-step approach to building the system prototype:
- Uncover the fundamental model
- Add complexity
- Enrich the system with data
Fundamental model
I applied first principles thinking to deconstruct geopolitics into its core components.
After spending some time with ChatGPT & Gemini, I identified the most basic underlying structure.
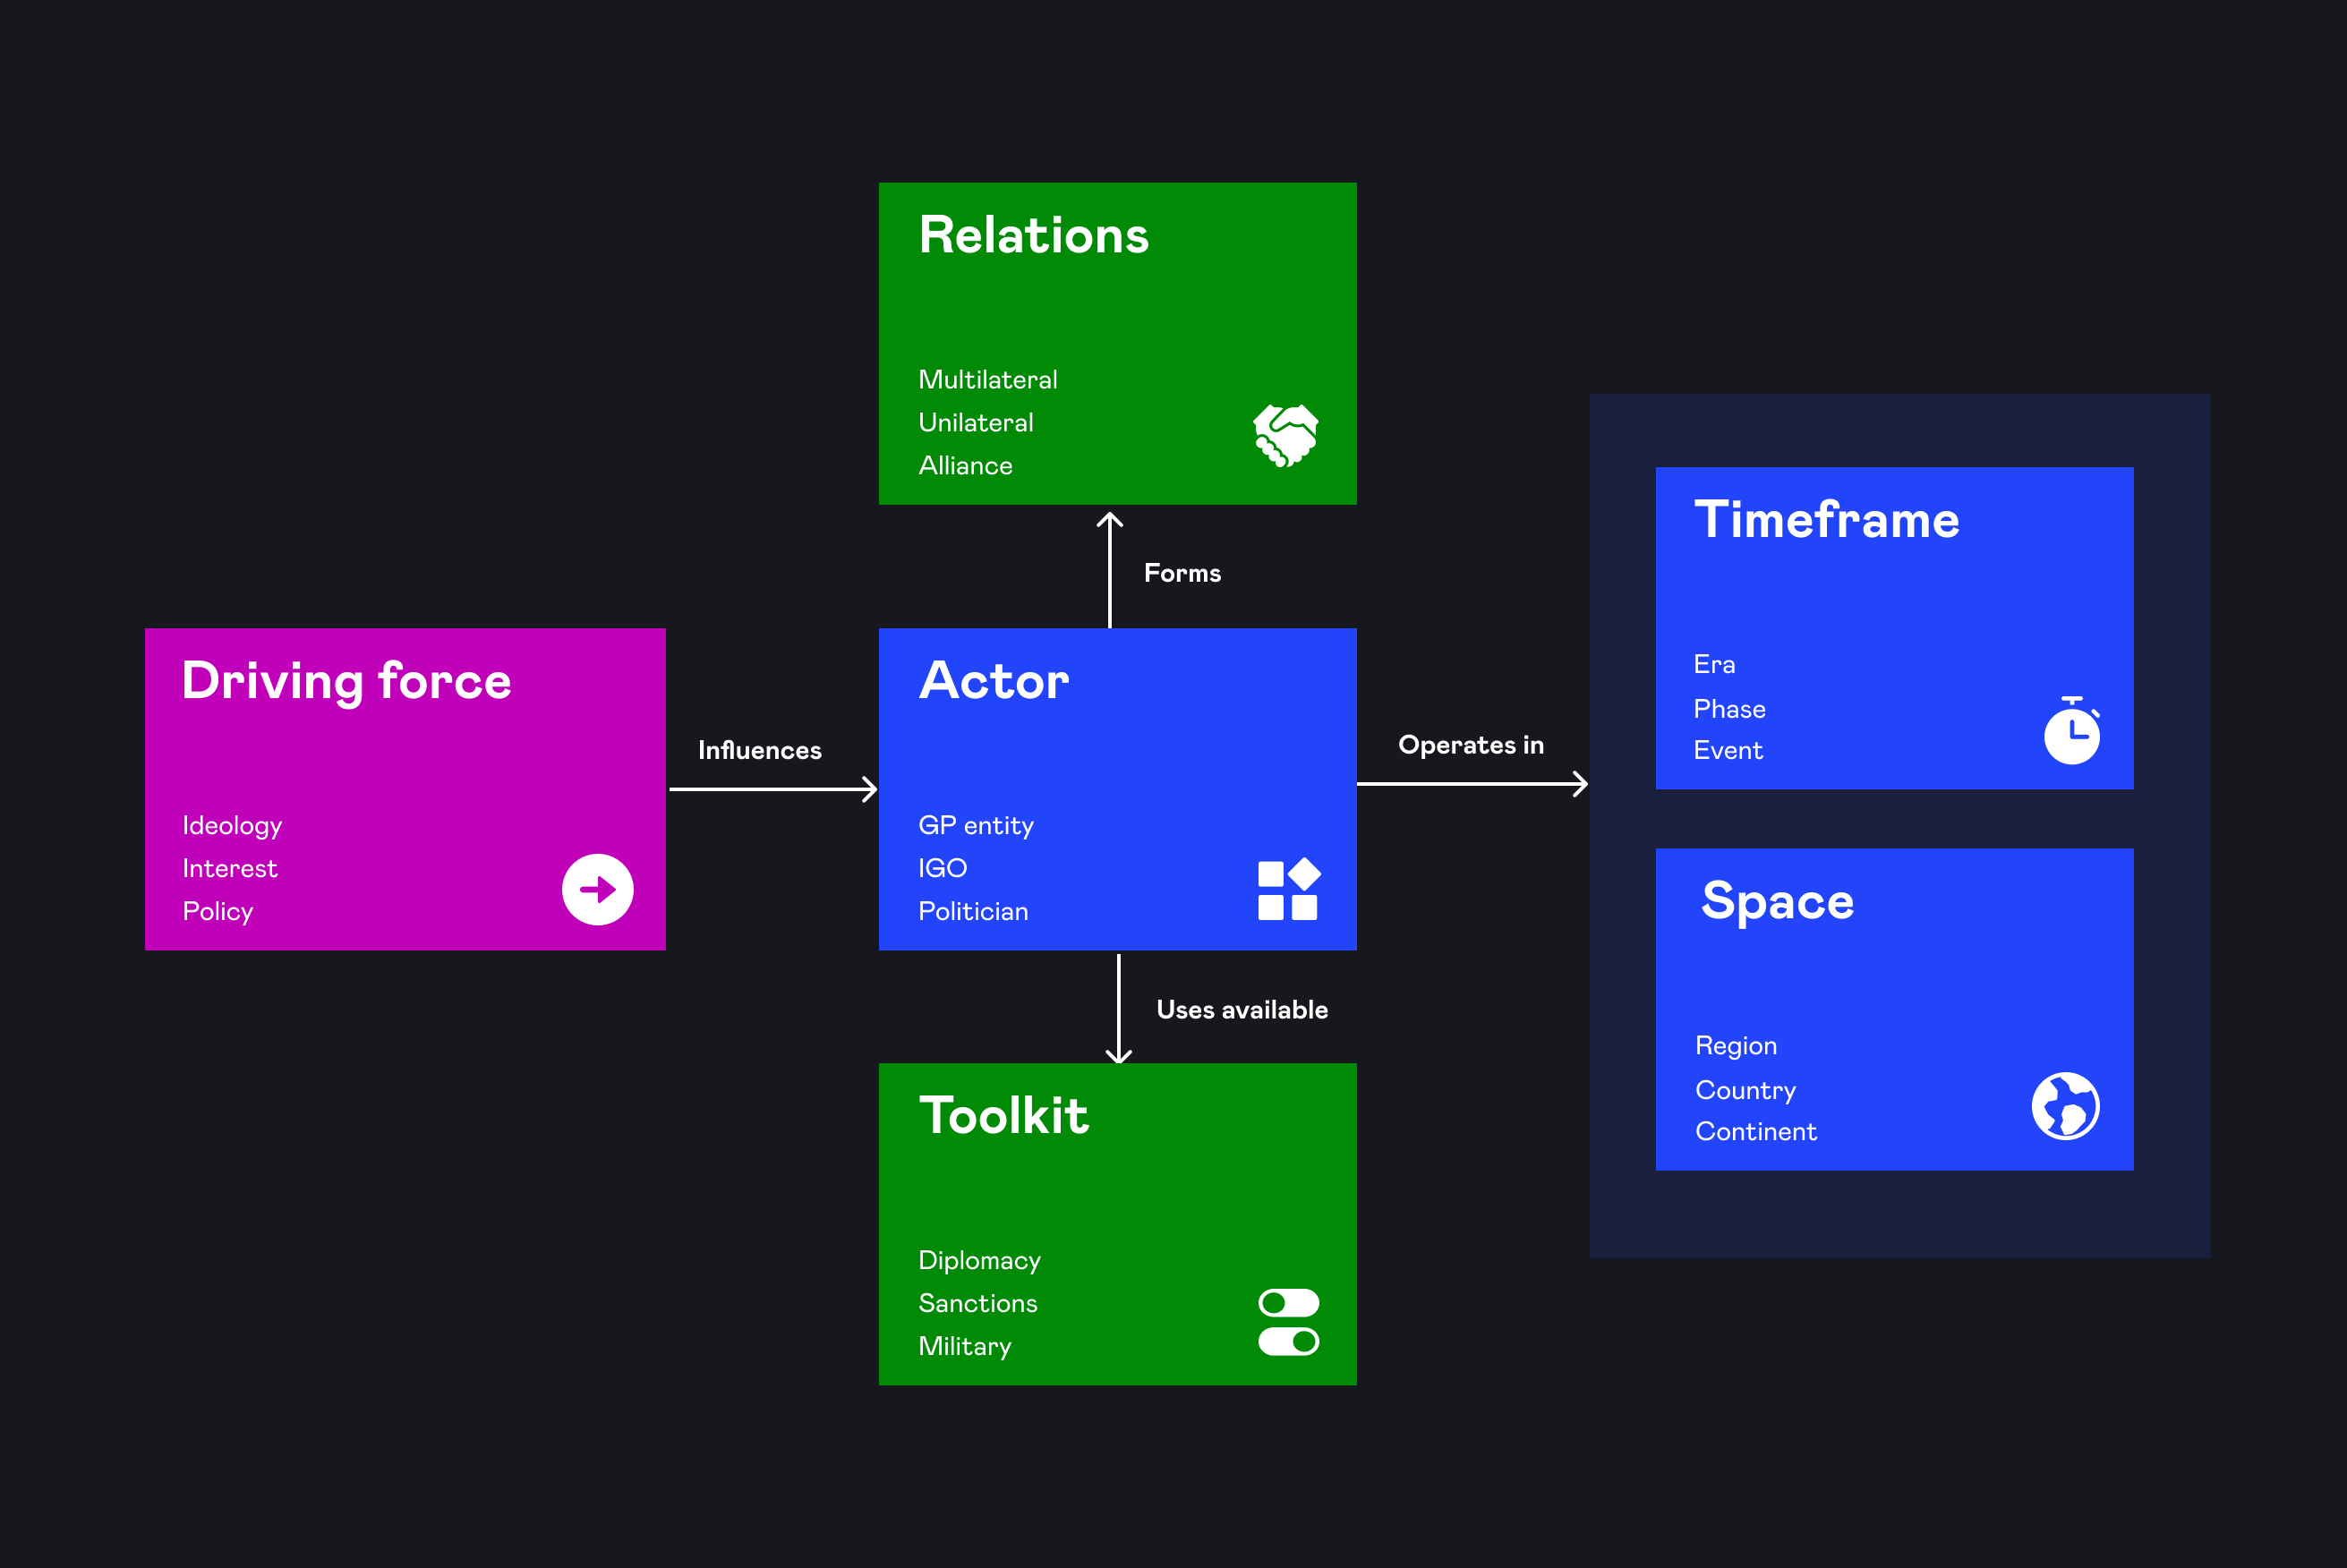
It includes six core entities:
Geopolitical Actors
Countries, organizations, unions, politicians and so on.
Space
Actors operate in a specific geographic context.
Timeframe
Actors operate in a specific historical context.
Driving forces
Actors are influenced by both external and internal driving forces: interests, motivations, goals, region dynamics, disruptions and so on.
Toolkit
Actors have various tools they can use to achieve their goals: diplomatic, military, financial and so on.
Relations
Actors form relationships with other actors (voluntarily or involuntarily).
This is the most abstract & bare-bones level of geopolitics.
With this foundation in place, I could start making the system more nuanced by adding layers of complexity.
Exploring complexity & building ontology
At this point I've started to create a scaffolding for my system: the full ontology.
An ontology defines the key concepts in a domain and the connections between them. It can serve as a framework for my initial understanding.
Exploring edge cases helped me find coherent structures and identify contradictions.
In the process of development I figured out many things.
For example, the hierarchy and classification of different geopolitical actors.
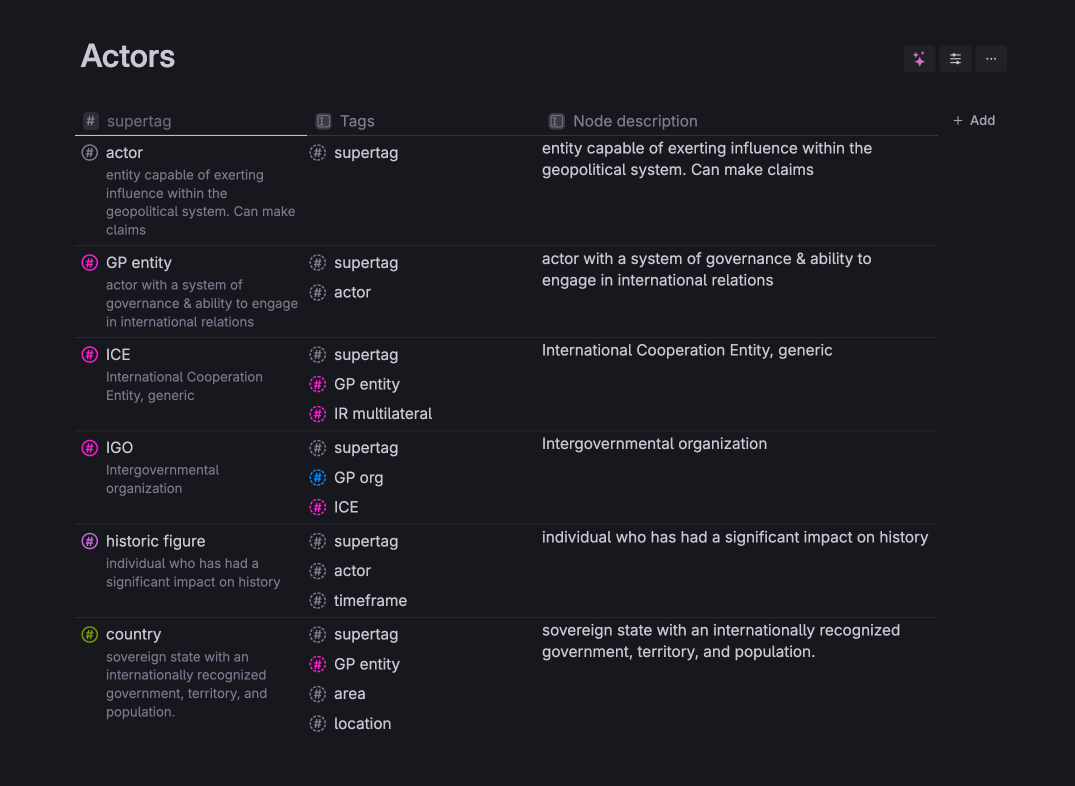
Actor is the base & most abstract entity.
Country can be an actor.
Also political party or even a single person.
Geopolitical entity (GP entity) is a more specific actor: it must have a system of governance & it can form international relations.
ICE (International Cooperation Entity) is the most generic cooperation. ICE can be viewed as Geopolitical entity (GP entity) and subsequently as an actor.
Also it can be viewed as a Multilateral International relation (IR multilateral)
IGO (Intergovernmental Organization) is a specific form of ICE (like United Nations or International Monetary Fund).
But it is also an organization (GP org).
This analysis allowed me to form a good grip on how different actors operate in the geopolitical space.
Prompt: You are an expert ontologist. Help me to develop a coherent and comprehensive ontology for <domain>. Include entities like: <list of entities>
I applied the similar approach to other parts of the system.

I've learned sooo much from this practice!
Geopolitics now starts looking more like a logical system, not an overwhelming stack of complex information.
Adding data
When the first version of the ontology is built into Tana, it’s time to populate the system with data.
You need to figure out what datasets might be useful for you to have right inside the system.
Next I will show you a few examples.
Countries
I got several datasets (population, size, GDP, HDI, Gini) from trustworthy sources.
Then I merged them in ChatGPT and converted the data into Tana paste format.
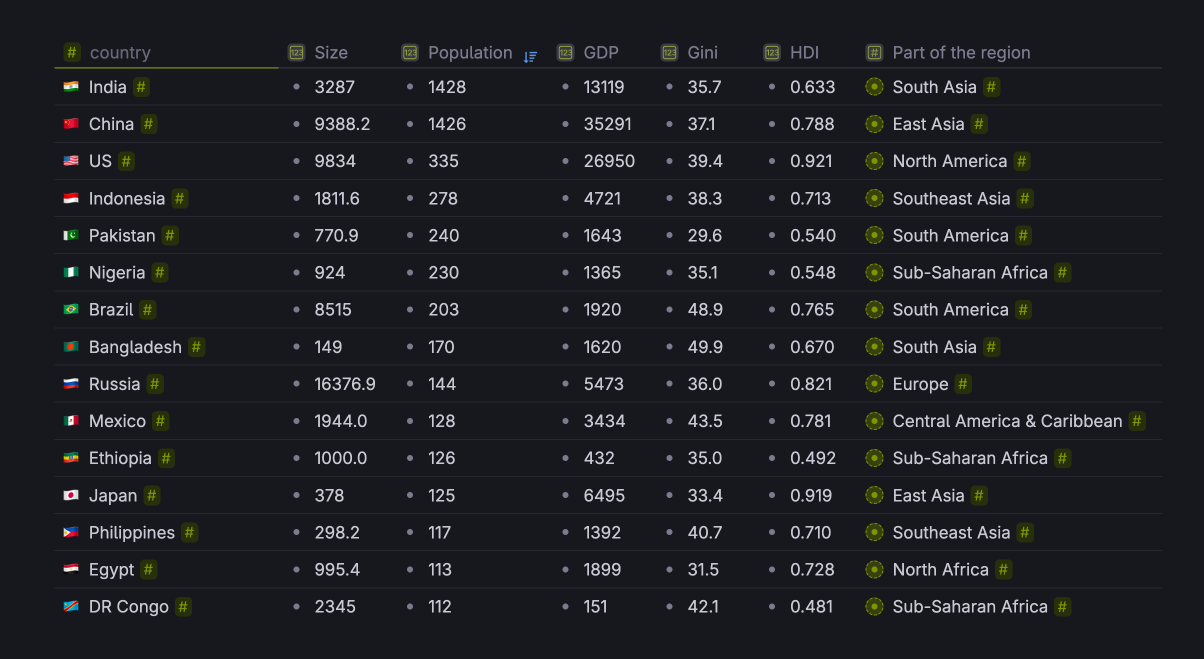
30 minutes, and now I have a lot of useful information right inside my Tana. I will use it as context & scaffolding for my knowledge.
Next I created the framework to group different countries based on their economy & development.
Existing frameworks could not quite capture the features I needed.

I instantly connected this framework to the countries database. AI helped me to group countries and explain the reasoning behind it.
International Cooperation & Organizations
I imported key ICEs (International Cooperation Entities) to Tana. Each one includes all the member countries.
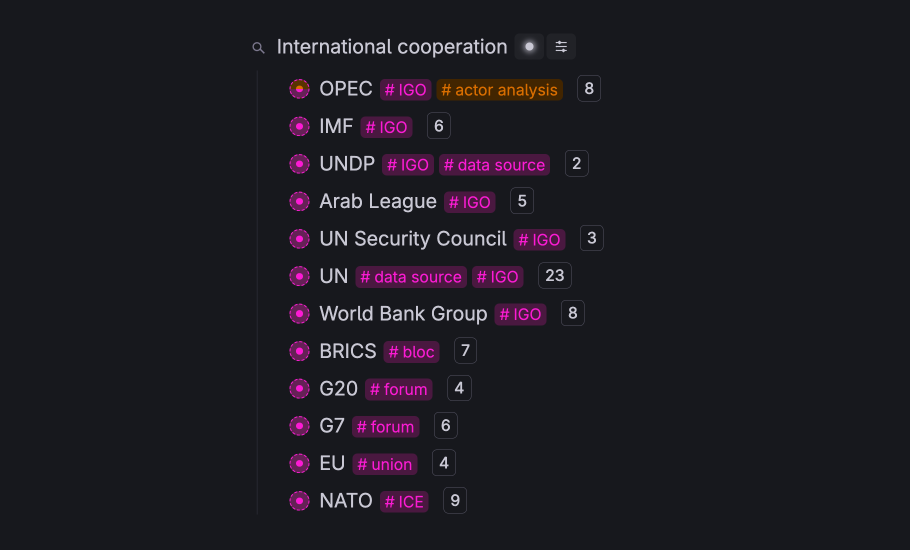
It allows me to see for each country all the relevant ICEs and visualize clusters/graphs.

Now let's explore 3 use cases of how the environment helps me integrate knowledge from multiple sources.
CASE 1: Megacities
In the recent CIFS report one particular topic caught my attention: Megacities.
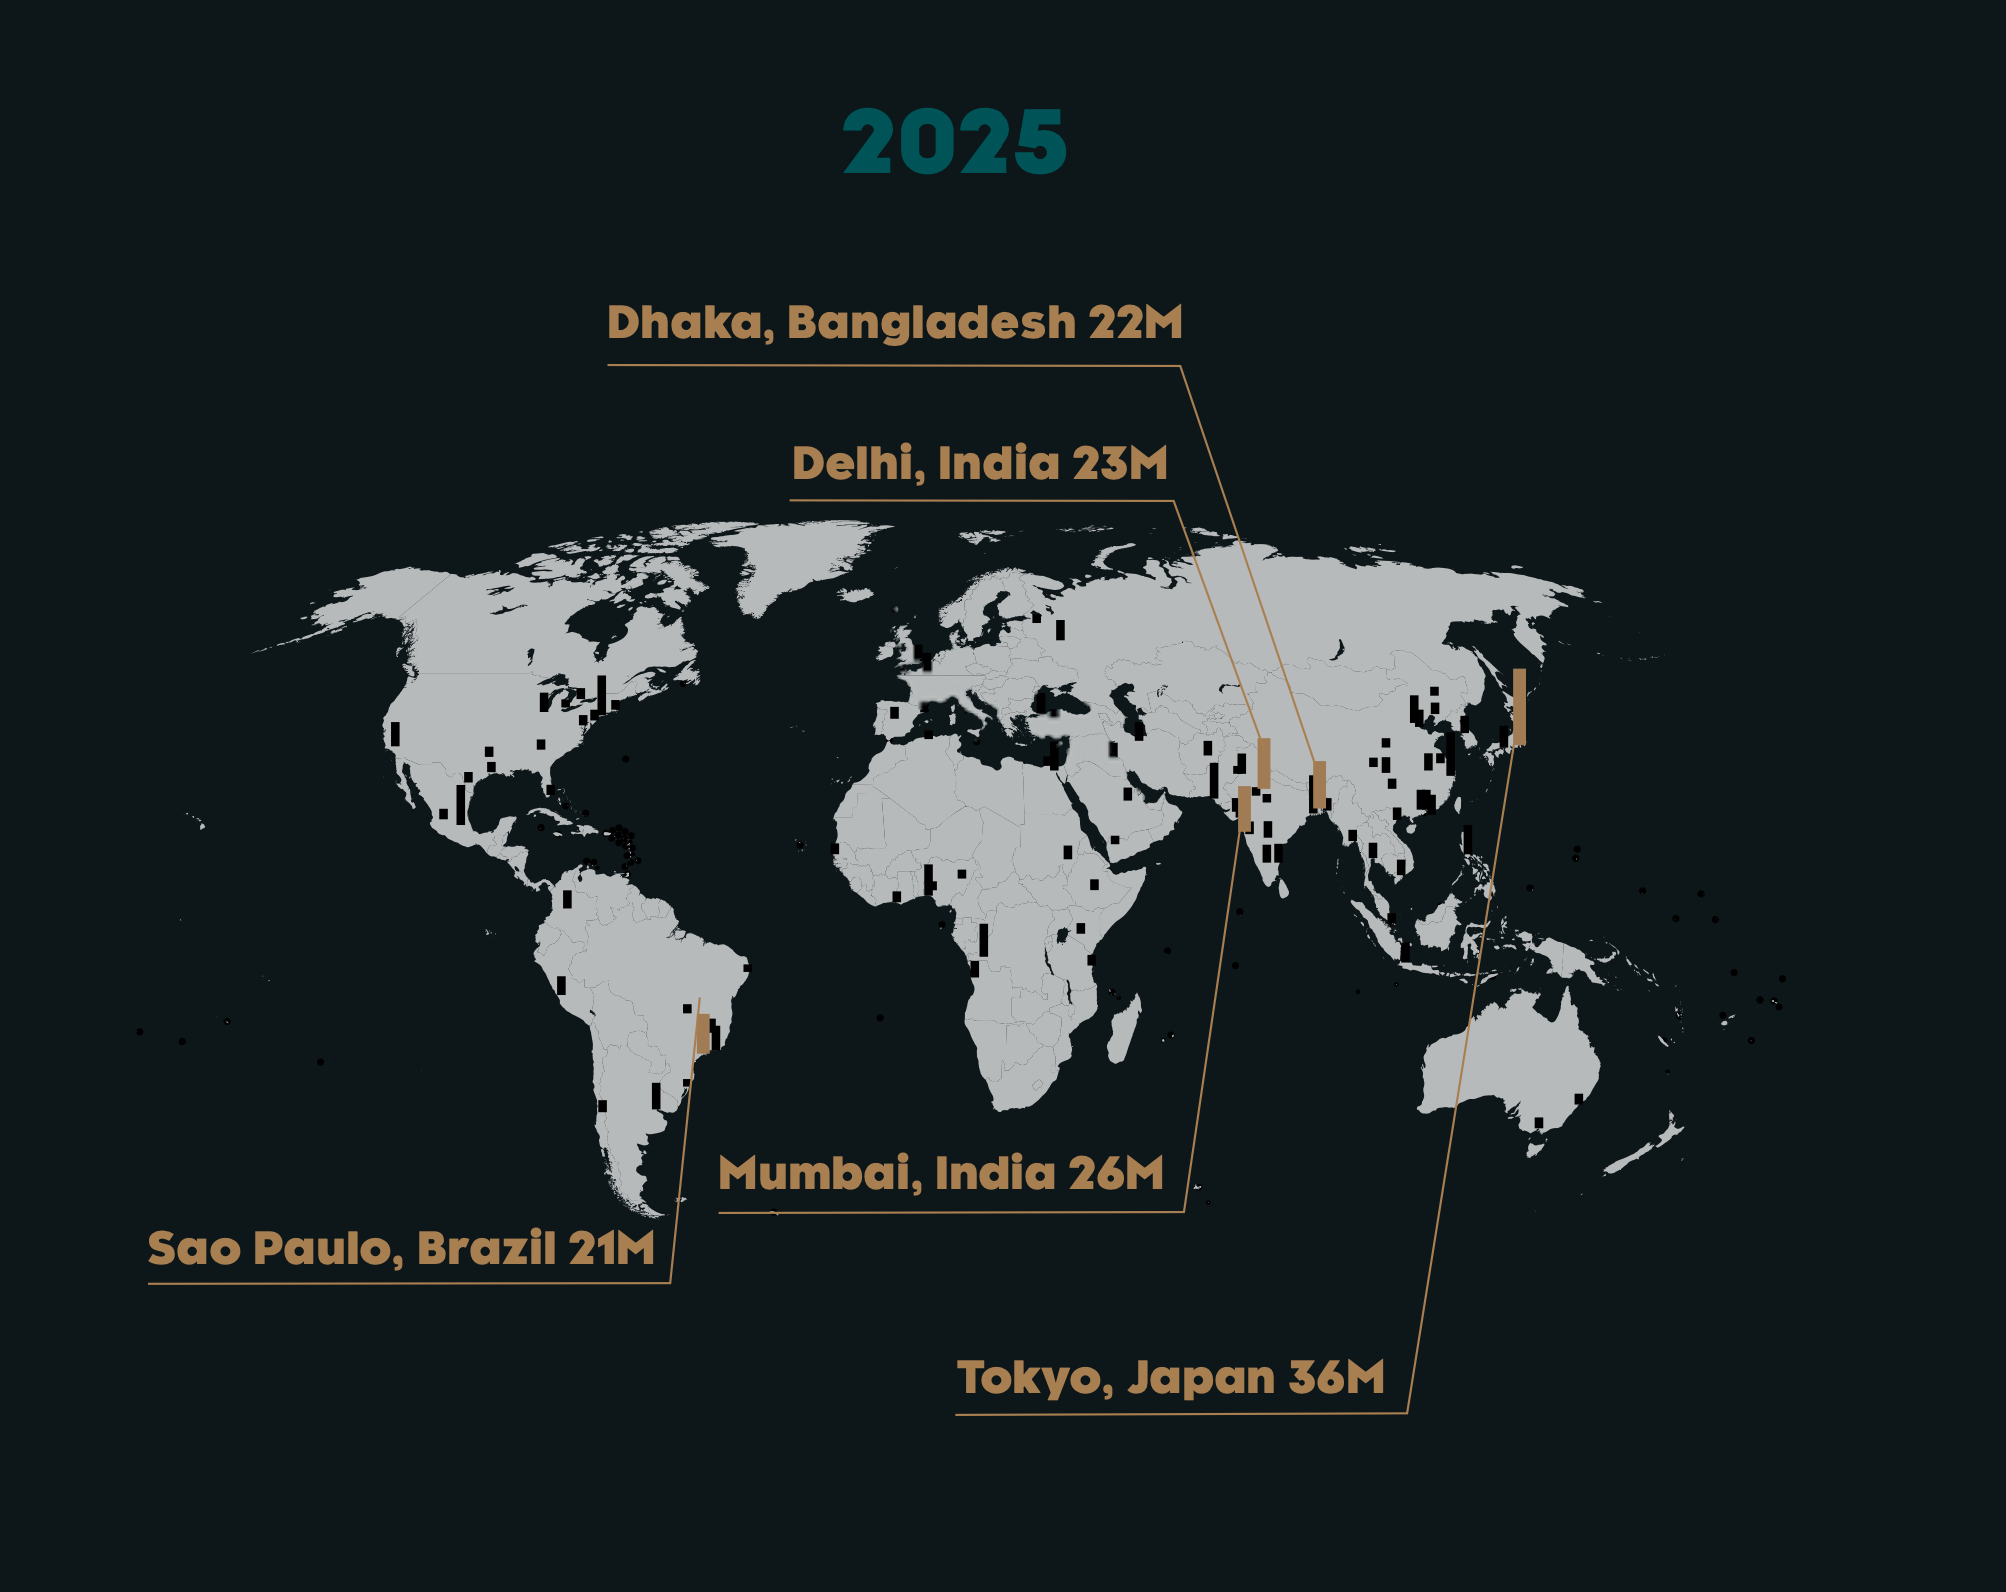
This trend significantly influences geopolitics: megacities are becoming major economic and political powerhouses, sometimes even rivaling or surpassing the influence of their nation-states on the global stage.
So now I want to incorporate this knowledge into my system.
First of all, I tag Megacities as #megatrend. Now, it is among other megatrends I identified.
CIFS provides an estimation for each megacity's population.
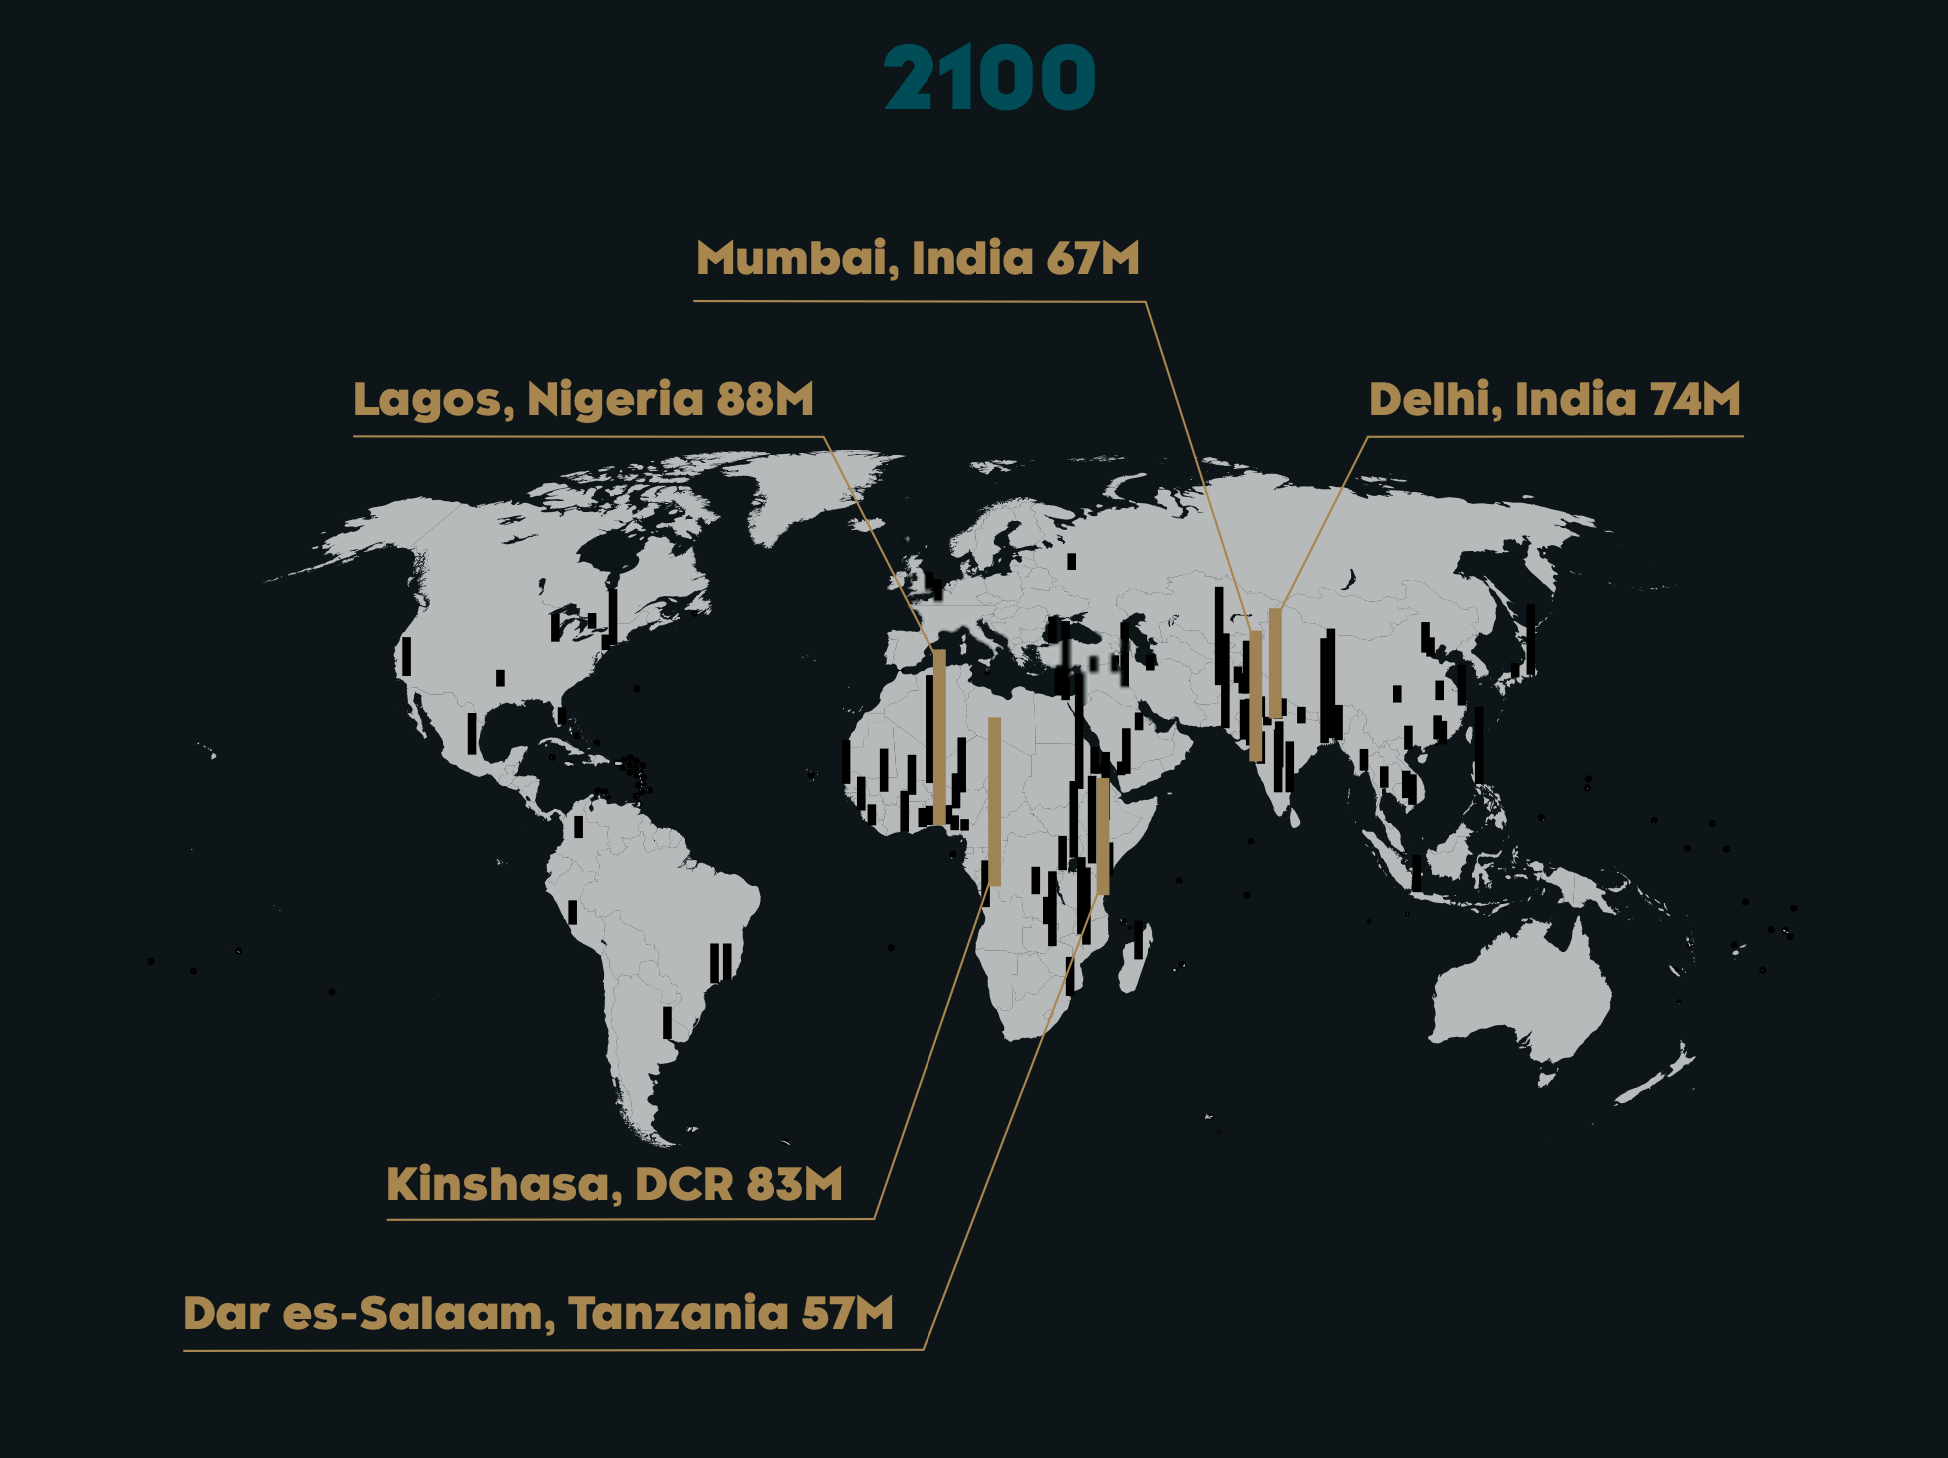
I create a #megacity supertag which extends #city supertag.
Adding an important field: 2100 Estimated population,
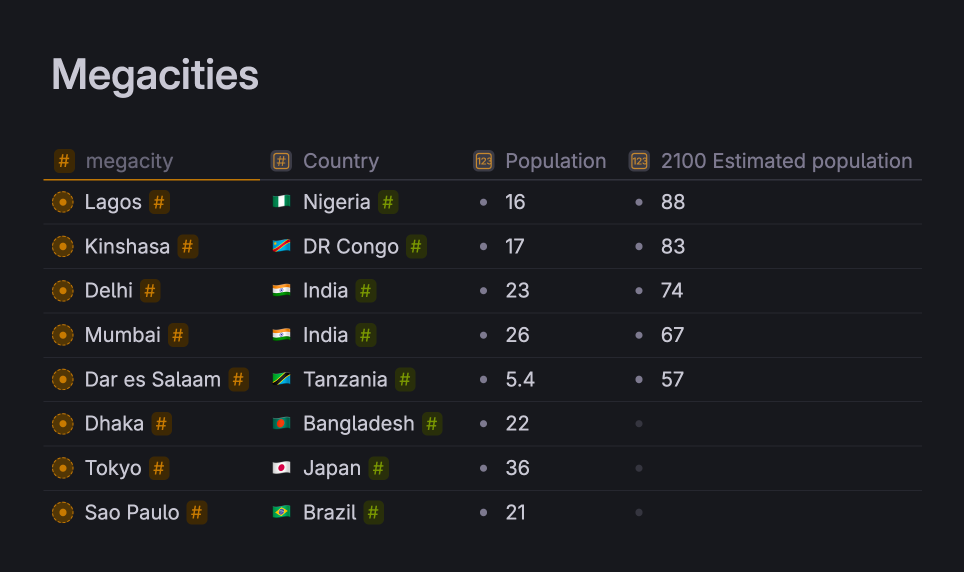
Now, the environment allows me to see things in context:
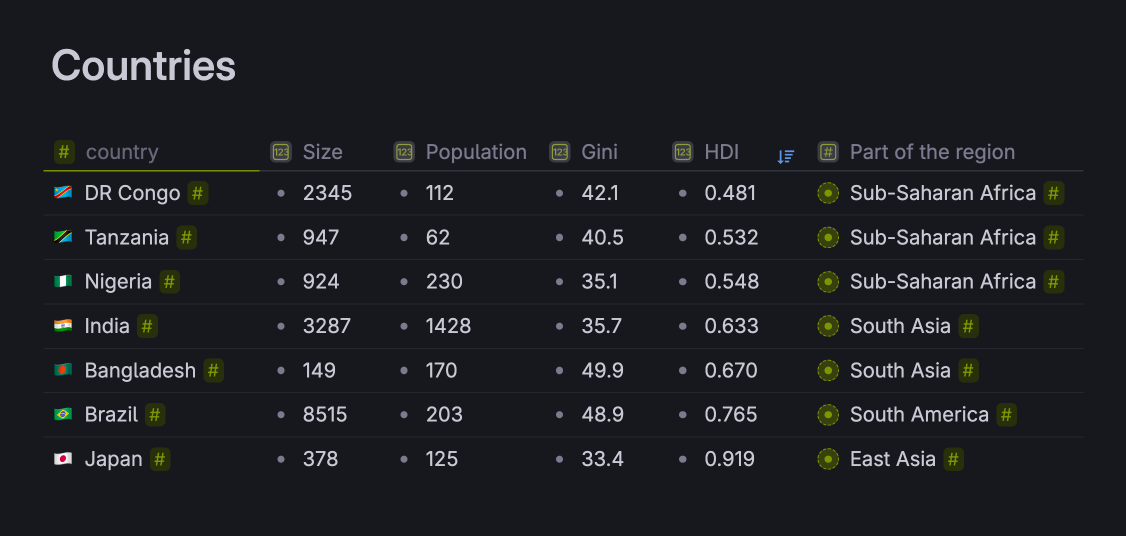
Now we can see: by 2100 most megacities will be located exclusively in Sub-Saharan Africa & South Asia
This is where major development & population growth is gonna happen in this century.
According to CIFS, Tokyo & Sao Paulo will lose their megacity status by the standards of 2100. As you see, Japan & Brazil are the most developed countries on the list (considering HDI, Human Developing Index).
It also confirms the general hypothesys of megacities becoming developing (by today's definition) countries' phenomena.
This new information emerged almost effortlessly from a well-designed environment.
CASE 2: OPEC
From this Stephen Kotkin’s lecture I’ve learned:
OPEC is an example of successful cooperation between non-aligned nations
This is super interesting! Definitely something that I want to explore further: international cooperation and alignment.
I connect this quote to the OPEC node, go there and now I can easily see all the nations it includes (remember that earlier I've imported the international cooperation dataset).
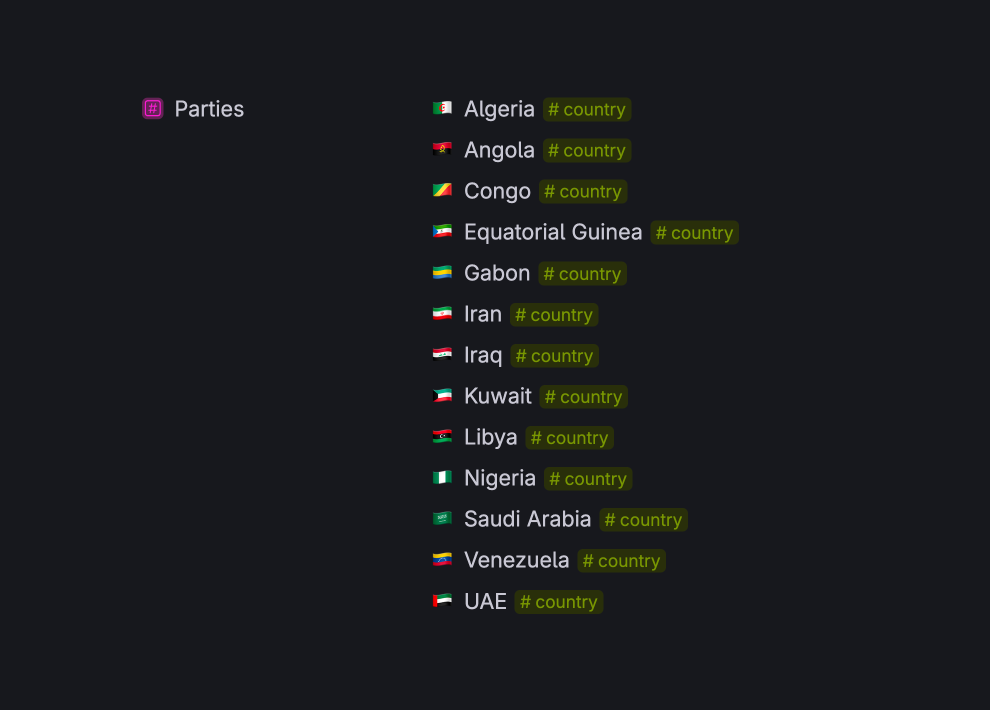
Kotkin’s quote makes more sense now!
CASE 3: Cold War map
Another great source for my research is a book: History of the World Map by Map
The substantial part of my system is dedicated to historical analysis.
Let's take for example this map from the book:

First, I put it into the #map structure and connect it to the relevant historical developments/theme.
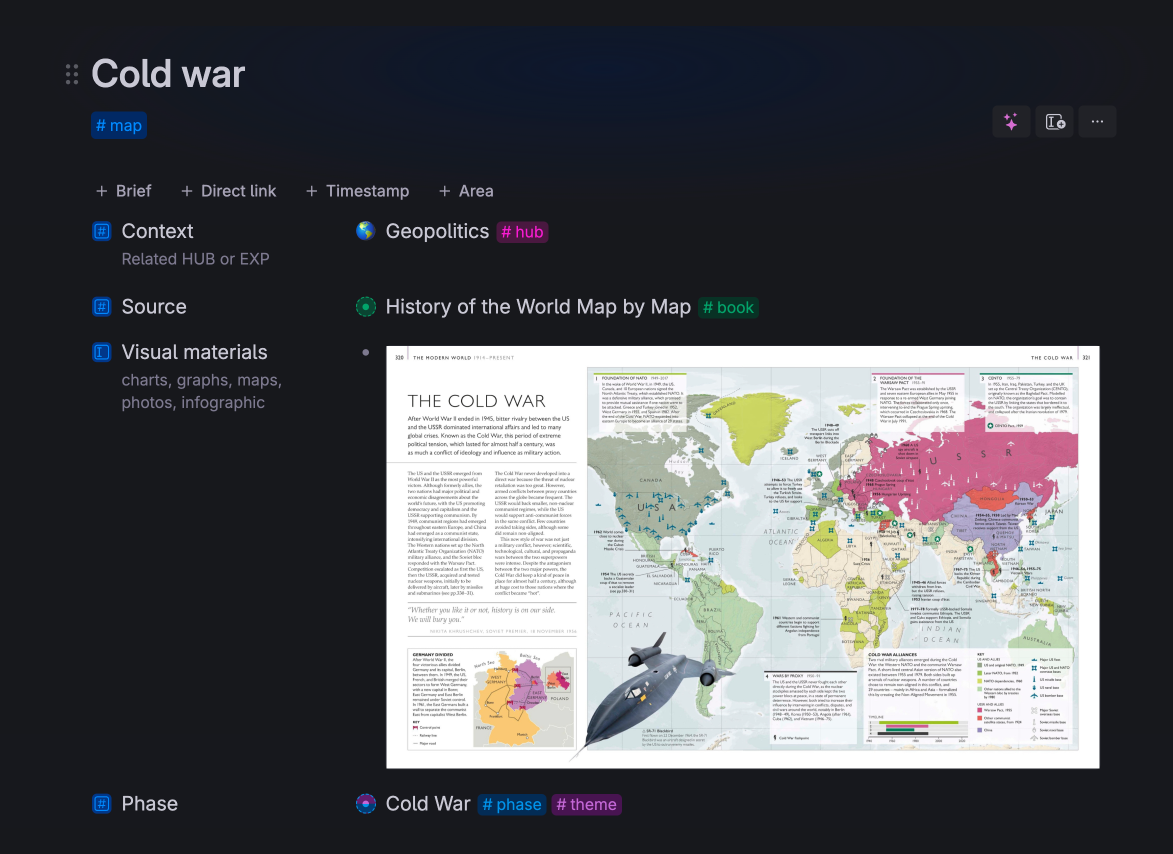
On this map I see one very important event: NATO formation. I definitely want to capture it using #event structure.
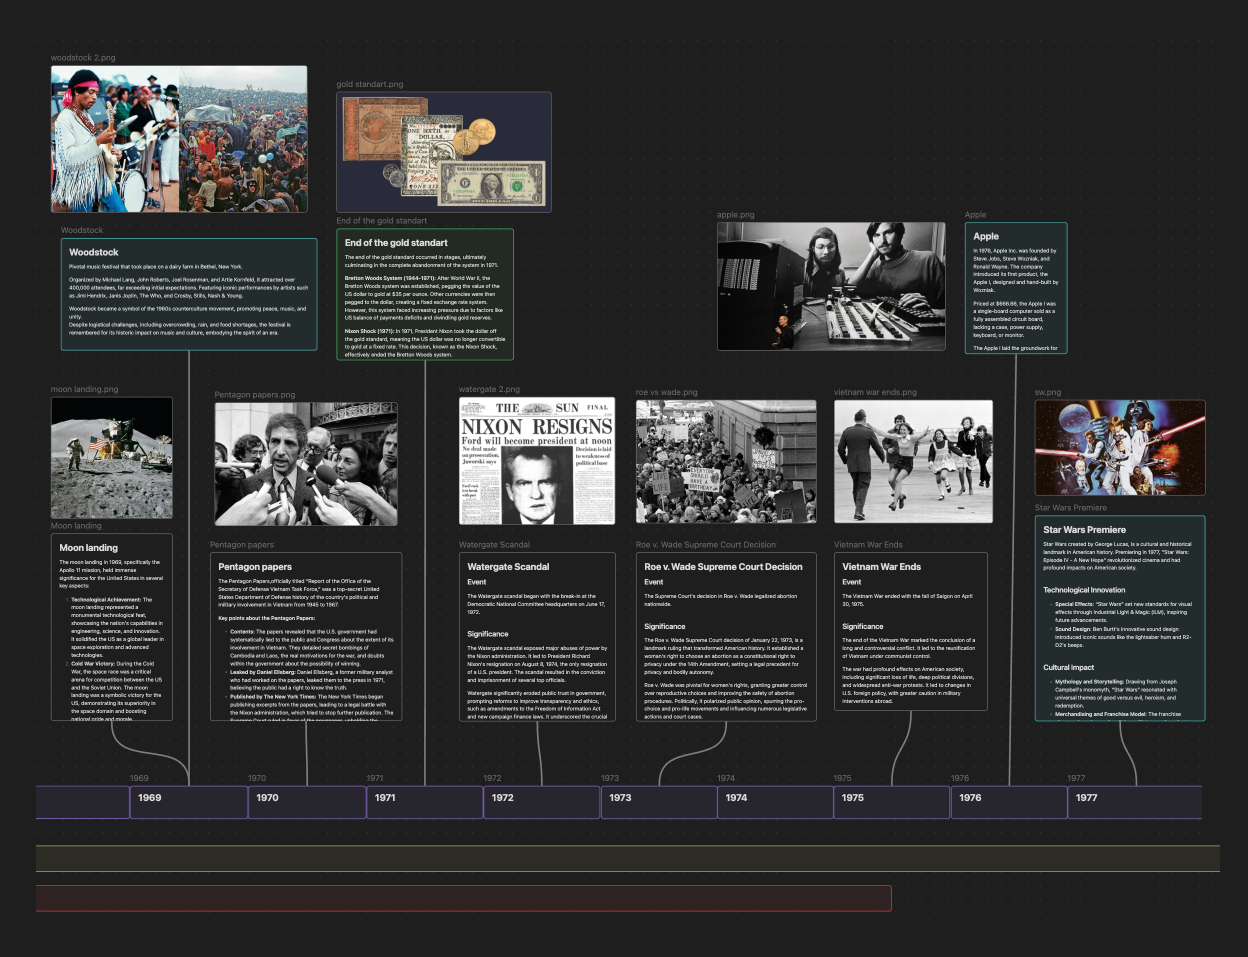
Now I have an opportunity to see this event in the context of another events from the XX century American history.

For that I use the card view grouped by phases (like WW2, Cold War, Civil Rights Movement and so on)
I also like to have a full sequential timeline in Obsidian Canvas.
Wrapping up
This environment demonstrates the potential of how Tana [connected with other tools] can be used to explore, learn, analyze, and make sense of complex topics.
Andy Matuschak & Michael Nielsen defined Tools For Thought as
A context in which the user can have new kinds of thought, thoughts that were formerly impossible for them
I think it's safe to say → their vision is a reality now!

